




As Chips Shrink, Failure Analysis Gets Harder: NVIDIA Uses LiteScope AFM-in-SEM
 |  |
 |  |
LiteScope AFM in SEM Electron Microscope Atomic Force Microscope
When the advanced process advances to 5nm or even 3nm, the number of transistors in a chip is approaching 100 billion. However, for failure analysis engineers, process progress brings not only performance improvement, but also more and more difficult positioning problems: defects are getting smaller and smaller, more and more hidden, and the sensitivity of traditional methods is approaching the limit.
Recently, NVIDIA, in collaboration with Nenovision, a manufacturer of LiteScope AFM in SEM electron microscopy, published a study proposing a failure analysis protocol that integrates conductive atomic force microscopy (C-AFM) and plasma-focused ion beam (pFIB) in the same vacuum chamber. This protocol not only drastically shortened the analysis process, but also gave birth to a new imaging technology, Scanning EBIC Microscopy (SEBICM).
This article will start from the problem, disassemble what the integration solution solves, how it works, and how effective it is.
01| Advanced process failure analysis, where is the difficulty?
In traditional semiconductor failure analysis, electron beam and ion beam passive voltage contrast (PVC) technology has been the main means of defect localization. However, under the advanced process node, the limitations of this method are becoming more and more obvious: its sensitivity to weak electrical defects, or defects buried under the surface, has dropped sharply.
The advent of conductive atomic force microscopy (C-AFM) largely compensated for this shortcomings. The C-AFM raster scans the surface of the sample with a sharp conductive probe while applying a bias between the probe and the sample, measuring the local current point by point. In this way, not only the topography is obtained, but also a quantitative current distribution map is obtained.
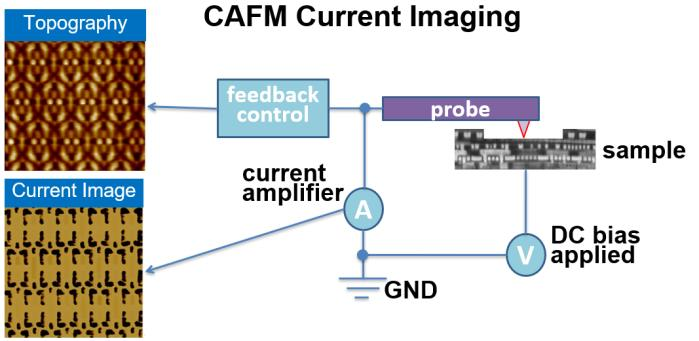
Figure 1: Schematic diagram of the working principle of C-AFM and an example of the morphology and current image of the IC sample
A C-AFM current map can simultaneously contain quantitative current data for hundreds or thousands of nanometer devices, which makes it particularly valuable for defect analysis of nanometer devices such as FinFETs.
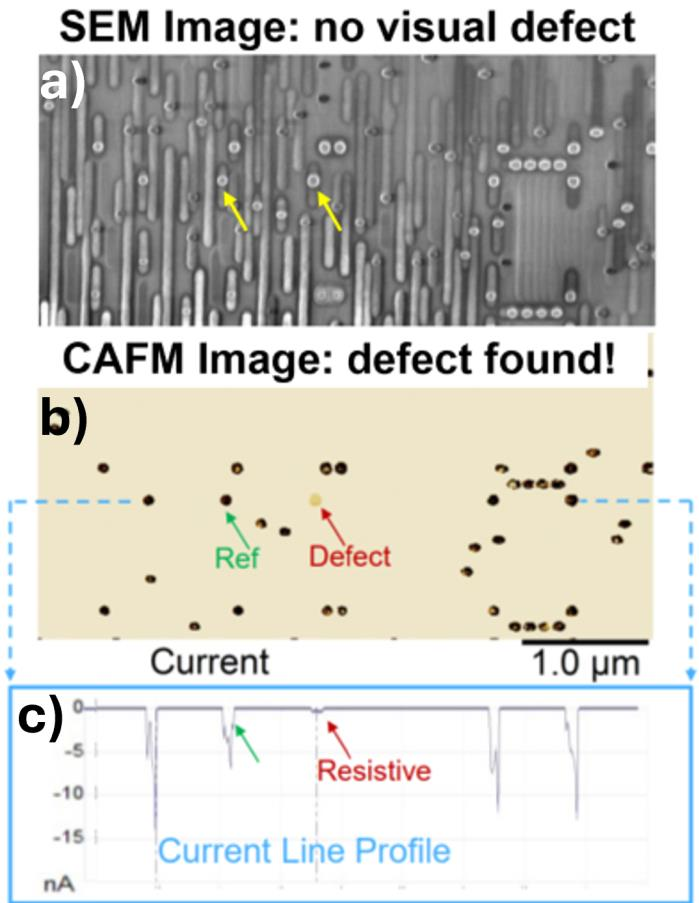
Figure 2: C-AFM successfully locates resistive through-hole defects, while mainstream SEM PVC technology fails to find the same defects
The above figure is a typical case: a defective through-hole (Via), which is completely invisible in the SEM PVC image, but the C-AFM current diagram clearly marks the abnormal position, and the current line section also shows that the current level of the defective through-hole is significantly lower than the reference through-hole.
02| C-AFM is strong but has an inescapable bottleneck
Despite its high sensitivity, C-AFM is extremely demanding for sample preparation. The probe must be in reliable electrical contact with the device structure at the nanoscale, and the surface of the sample must be clean, free of oxidation, and free of pollution.
Conventional delamination methods - chemical mechanical polishing (CMP) - are problematic at this point. During and after polishing, the conductive circuit structure is exposed to an atmospheric environment, and an oxide layer is easily formed on the metal surface. With advanced processes, the introduction of new materials such as cobalt contact exacerbates the problem - cobalt oxidizes rapidly when exposed to air at room temperature.
The presence of plasma-focused ion beam (pFIB) gas-assisted etching makes the delamination process more precise and controllable. The reaction gas is injected into the cavity through the nozzle, and the plasma ion beam can selectively and uniformly mill the target area, while the electron beam can monitor the progress of delamination in real time.
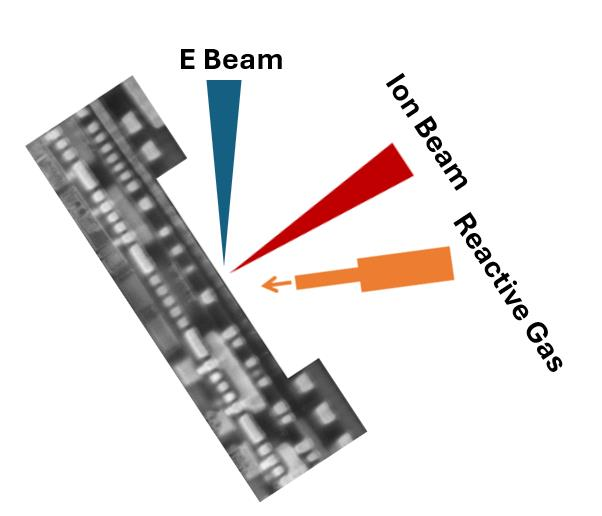
Figure 3: Schematic diagram of pFIB gas-assisted delamination for C-AFM sample preparation
But even if a sample is prepared with pFIB, one problem remains: the sample is to be transferred back and forth between the pFIB cavity and the C-AFM device. Every transfer means exposure to the atmosphere, and the risk of oxidation comes with it. It is also time-consuming and laborious to relocate to the area of interest after each transfer.
03| Core scenario: loading C-AFM into a pFIB/SEM dual-beam system
NVIDIA's line of thinking with Nenovision is straightforward: since the problem lies in “transferring,” don't transfer.
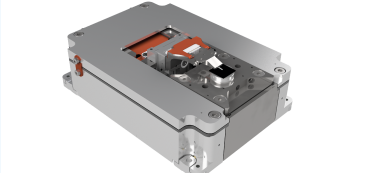
The LiteScope developed by Nenovision is a set of AFM devices (ie, AFM in SEM) in-situ integrated in the FIB/SEM. NVIDIA uses the LiteScope to implement AFM directly installed on the sample platform of the pFIB/SEM dual-beam system, so that delamination and electrical characterization are completed in the same vacuum chamber.
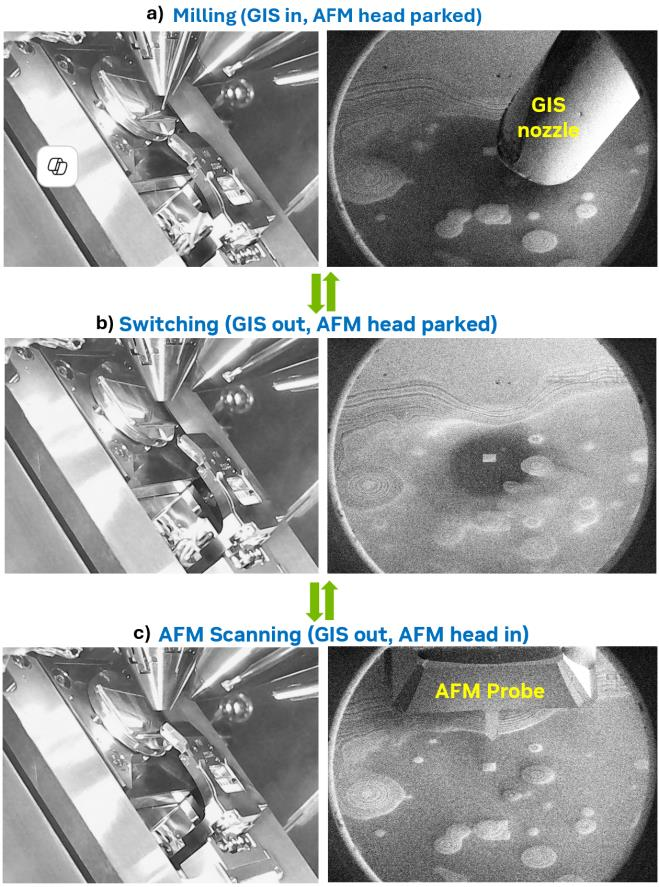
Figure 4: Three operating modes of the integrated system: (a) Milling mode (b) Switching mode (c) AFM scanning mode
The entire workflow seamlessly switches between three modes:
Milling mode
The AFM head retracts to a safe position, the gas injection system (GIS) nozzle delivers the reaction gas close to the target area, and the Xe plasma ion beam milling defines the area (100 × 100 µm ² window in the experiment). The delamination progress is monitored in real time by station current measurement and ion beam image brightness, intermittently confirmed by SEM imaging, and accurately stopped at the target circuit layer.
switch mode
Both the GIS nozzle and the AFM head return to the berthing position, ensuring a safe transition between milling and scanning.
AFM Scan Mode
The AFM head is lowered to the operating position and the conductive probe is subjected to C-AFM current imaging on the fresh surface after delamination.
The test sample is an integrated circuit die of the 5nm-class process. After being removed from the package, the thicker metal layer at the top is first removed by mechanical grinding, and then loaded into the AFM sample platform in the pFIB/SEM system. The sample table is tilted 52 degrees - this is the optimum angle for Xe plasma FIB milling and SEM imaging.
04| Effect validation: layer-by-layer de-layer + layer-by-layer imaging, logic unit and SRAM are taken down
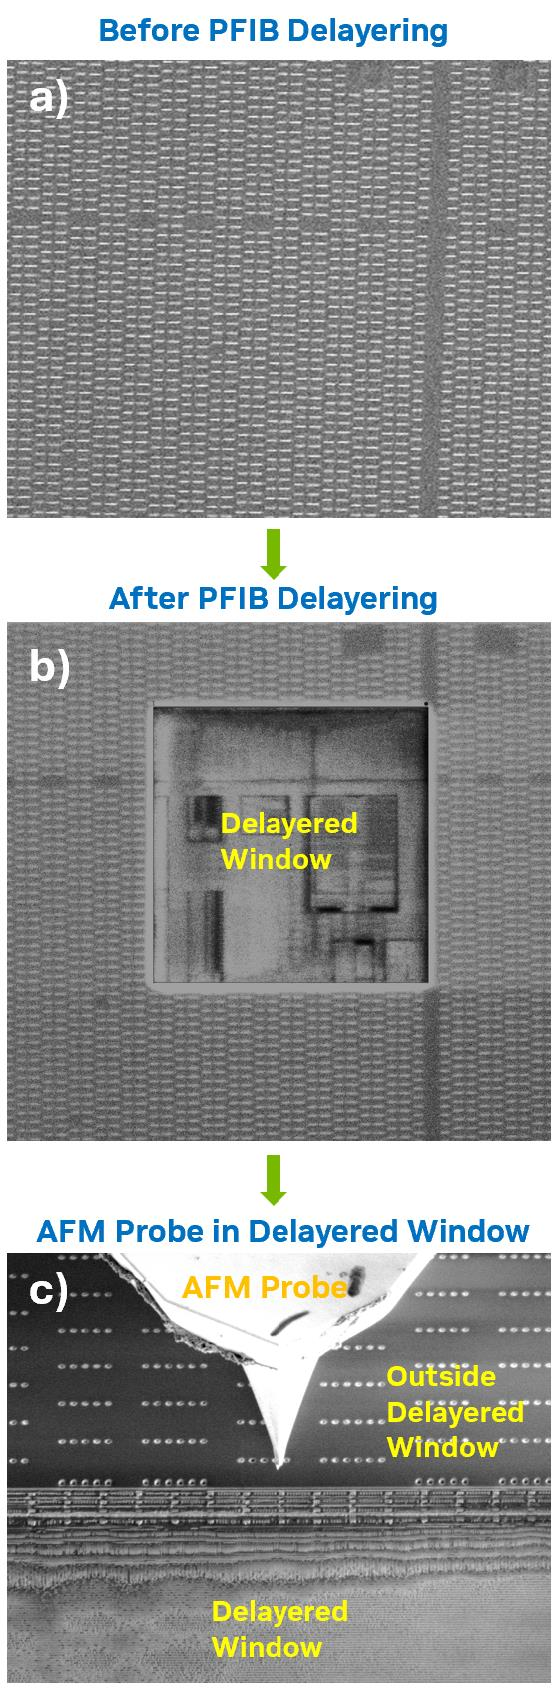
Figure 5: Target area SEM image: (a) pFIB gas assisted delamination before (b) delamination after (c) AFM probe positioned to delamination window ready for analysis
The delamination effect can be clearly seen from the SEM image: the 100 × 100 µm ² window is uniformly milled, exposing the underlying circuit structure, and the surface flatness reaches tens of nanometers or even better - this is exactly the surface condition required for high-quality C-AFM imaging. The cross-sectional profile of more than ten layers of metallized layers can be seen on the sidewalls of the window, which visually proves the depth and uniformity of the layer removal.
SEM Assisted Navigation
Moving from a puzzle to a simple thing
Another great benefit of LiteScope AFM in SEM is navigation efficiency. On traditional standalone AFM platforms, locating a probe to a specific transistor, logic cell, or memory cell is a tedious task: the AFM imaging itself takes a few minutes, and then the low-contrast AFM topography is manually compared to the layout design, which is both slow and error-prone.
In LiteScope AFM in SEM, the SEM images are acquired almost in real time and are rich in structural details - including sub-surface information due to material texture and edge effects. At a 52-degree tilt, the AFM probe tip is clearly visible in the SEM image, allowing real-time tracking and manipulation of probe movement.
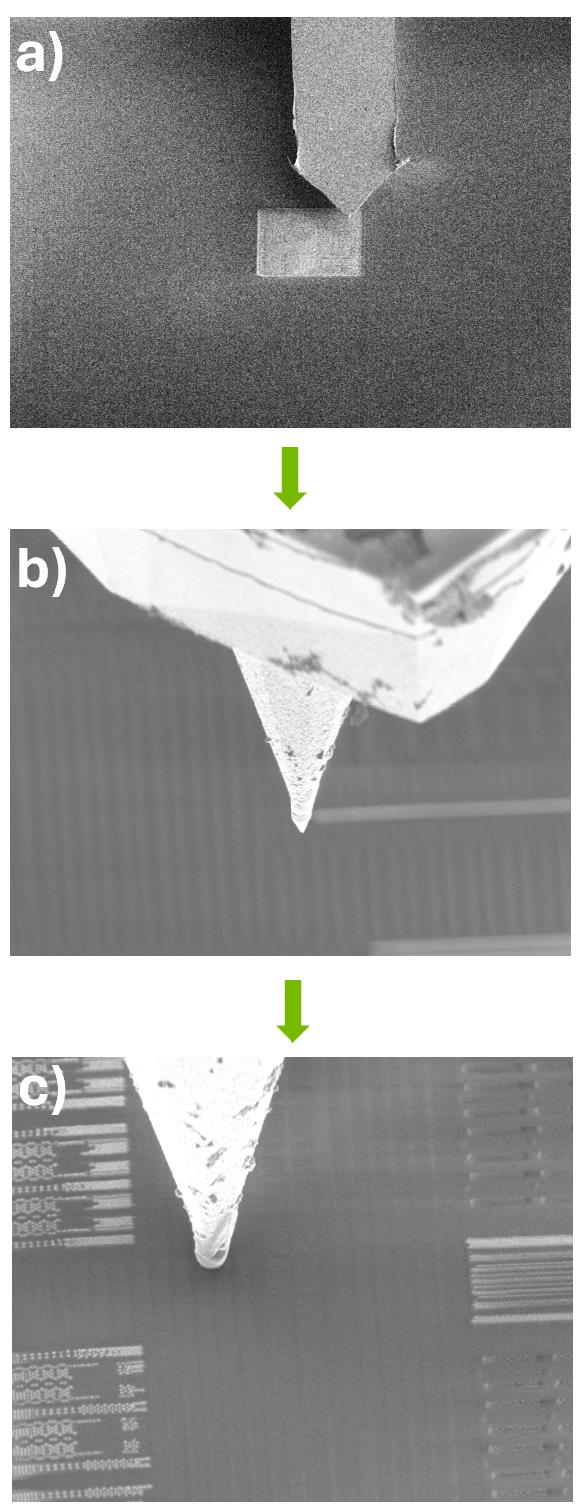
Figure 6: SEM imaging guides the AFM probe navigation to the target position: (a) Probe initial positioning (b) Step-by-step movement under real-time SEM observation (c) Probe precisely landed on the target circuit
FIB/SEM dual-beam systems are often also equipped with CAD navigation to synchronize the sample stage with the CAD layout to further accelerate the navigation process.
Layer-by-layer analysis
Multilayer Current Diagrams for Logical Cells and SRAM
After completing the C-AFM analysis of a certain layer, the probe is retracted, the system cuts back to the milling mode, continues the pFIB gas-assisted delamination to the next layer, and then reposition the probe and perform C-AFM imaging again. This "delamination-imaging- delamination" cycle can be repeated iteratively to achieve layer-by-layer electrical characterization of the target device or region.
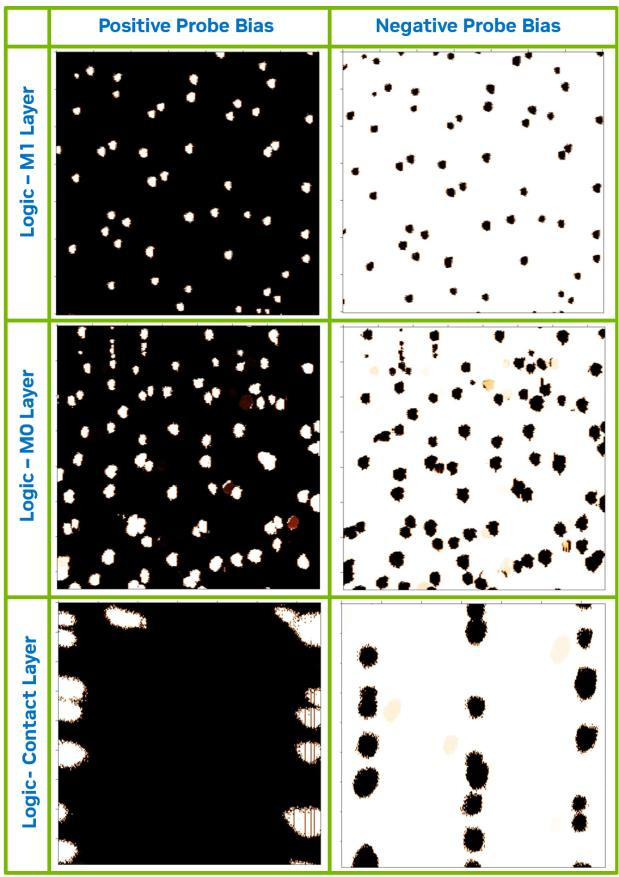
Figure 7: C-AFM current image of a 5nm logic cell after pFIB gas-assisted delamination to three different levels
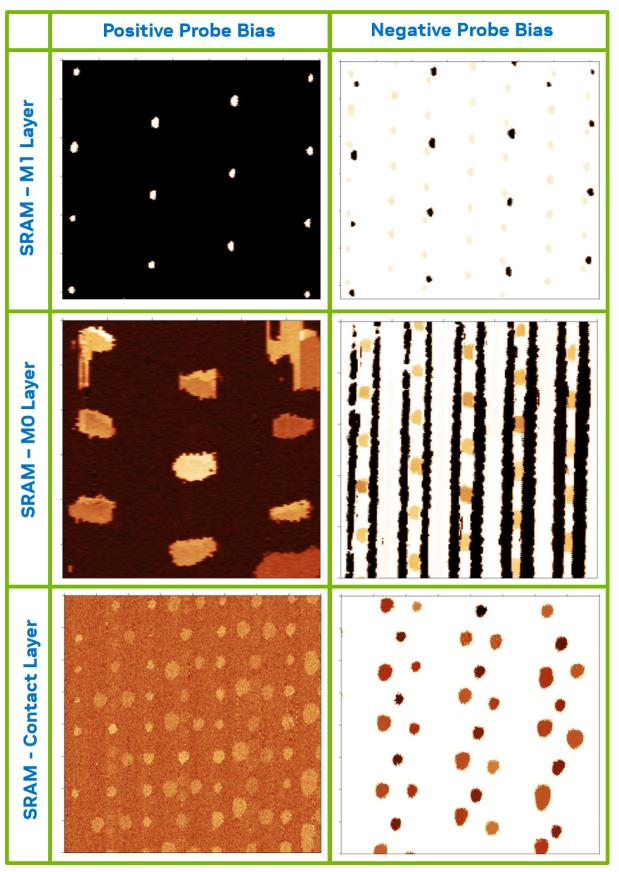
Figure 8: Current distribution diagram of 5nm SRAM bit cells after pFIB gas-assisted delamination to three different metallization levels
The above figure shows the C-AFM current images of 5nm logic cells and SRAM bit cells at three different circuit levels, respectively, and verifies the repeatability and accuracy of this set of layer-by-layer de-layer and analysis methods on different device structures.
The entire process from delamination to imaging is done in a single vacuum environment, without breaking the vacuum, transferring samples between different devices, and re-navigating after each analysis. The oxidation risk, contamination risk and misalignment caused by each tool transfer in the traditional process are completely eliminated here.
05| Unexpected Harvest: A new imaging technology is born
Integrating C-AFM and electron beams into the same system also gave birth to a new capability that traditional methods could not do.
Electron beam induced current (EBIC) is generated in the device when the device is delaminated to the contact layer and exposed to a parameter-optimized electron beam (acceleration voltage, beam current, relative positions of the electron beam and the AFM probe are all configured). These currents result from the generation of electron-hole pairs and the subsequent separation of carriers at the p-n junction.
By collecting these EBIC signals in real time during the raster scanning process, the C-AFM probe can reconstruct a two-dimensional image and map the junction behavior in the scanning area. The researchers named the new technique Scanning EBIC Microscopy (SEBICM).
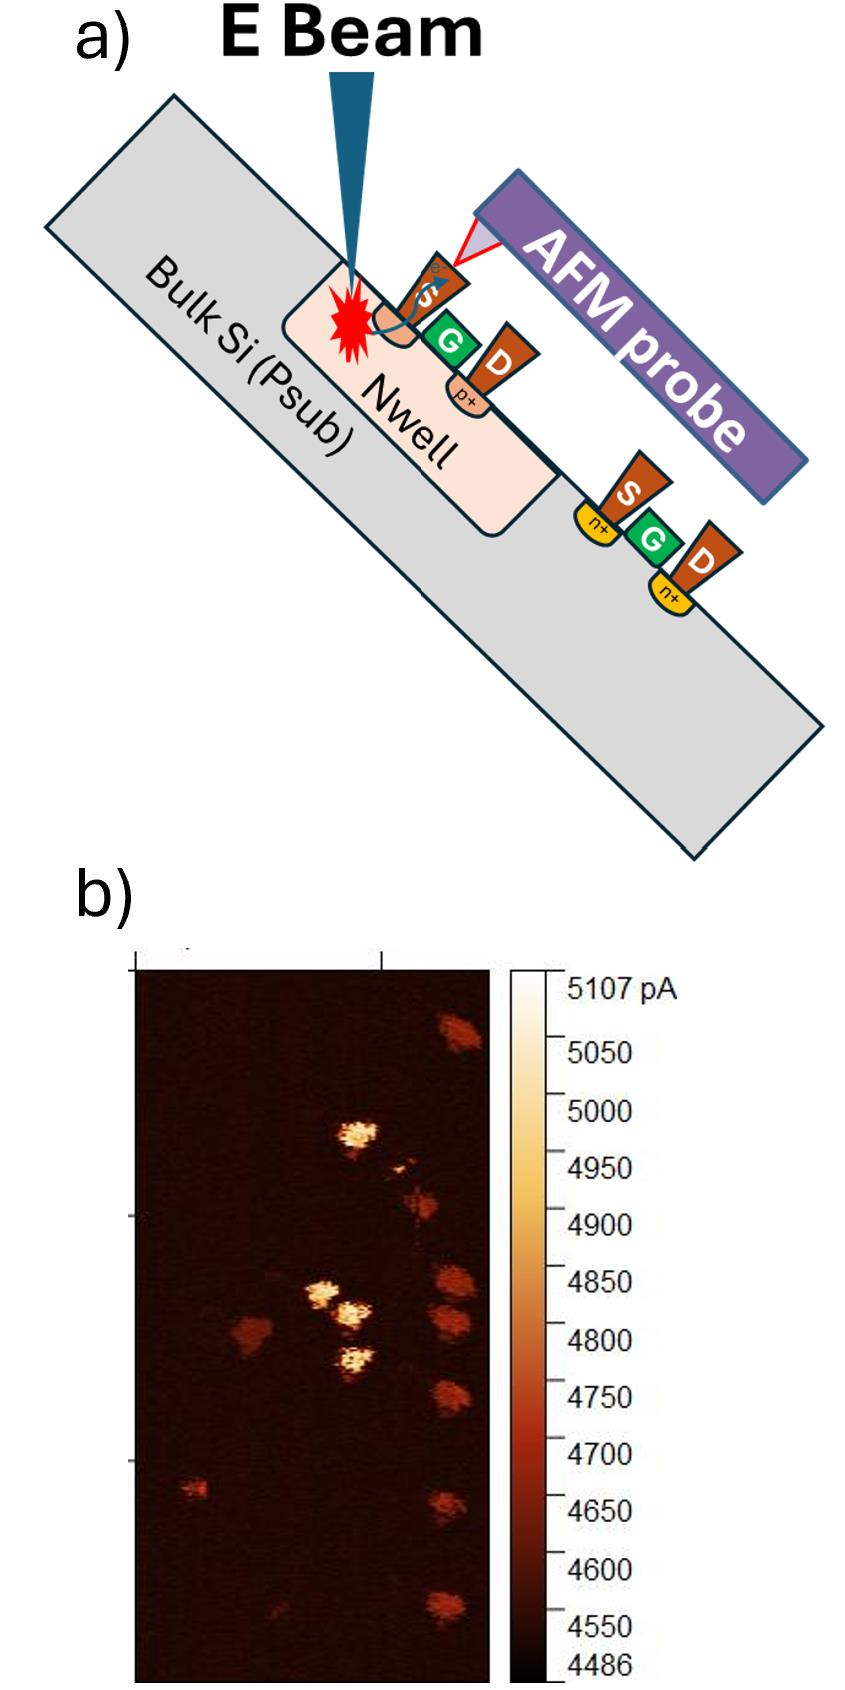
Figure 9: Scanning EBIC Microscopy (SEBICM) conceptual schematic and representative results: (a) cross-sectional schematic of the experimental device (b) SEBICM current image of the logic cell area
SEBICM enables spatially-resolved imaging of junction characteristics at the nanoscale, directly below a single contact. This is difficult to do with traditional failure analysis methods. From the result diagram, it can be seen that different contacts exhibit significantly different current levels, reflecting the difference in sub-surface junction behavior.
This technique promises to be used for partial analysis of junction quality to detect subtle junction-related anomalies - such as implant defects, junction leakage, or uneven doping - that are not seen in traditional SEM PVCs or even stand-alone C-AFMs.
06| Depth case: leakage gate positioning in a stacked die package
The most convincing case in the paper comes from the failure analysis of a stacked-die package. This case demonstrates not only the efficiency of the integration scheme, but also the unexpected role that pFIB plays in it.
The failed device is a die stack structure consisting of hundreds of transistors connected in parallel through a copper metallization layer. The analysis process is as follows:
The first step is to mechanically grind the package substrate to expose the suspicious die, and then grind and remove the top thick metal layer to reduce the subsequent pFIB delamination time.
In the second step, a compact AFM system is loaded into the pFIB cavity, and the gas-assisted parallel milling of the pFIB continues to delaminate until the top layer of the suspect circuit is exposed.
The third step is to immediately perform a C-AFM current scan on the suspect circuit. The topography diagram shows that the de-layer structure is uniform and clear, but the current in the current diagram is extremely low throughout the area - no abnormalities were found.
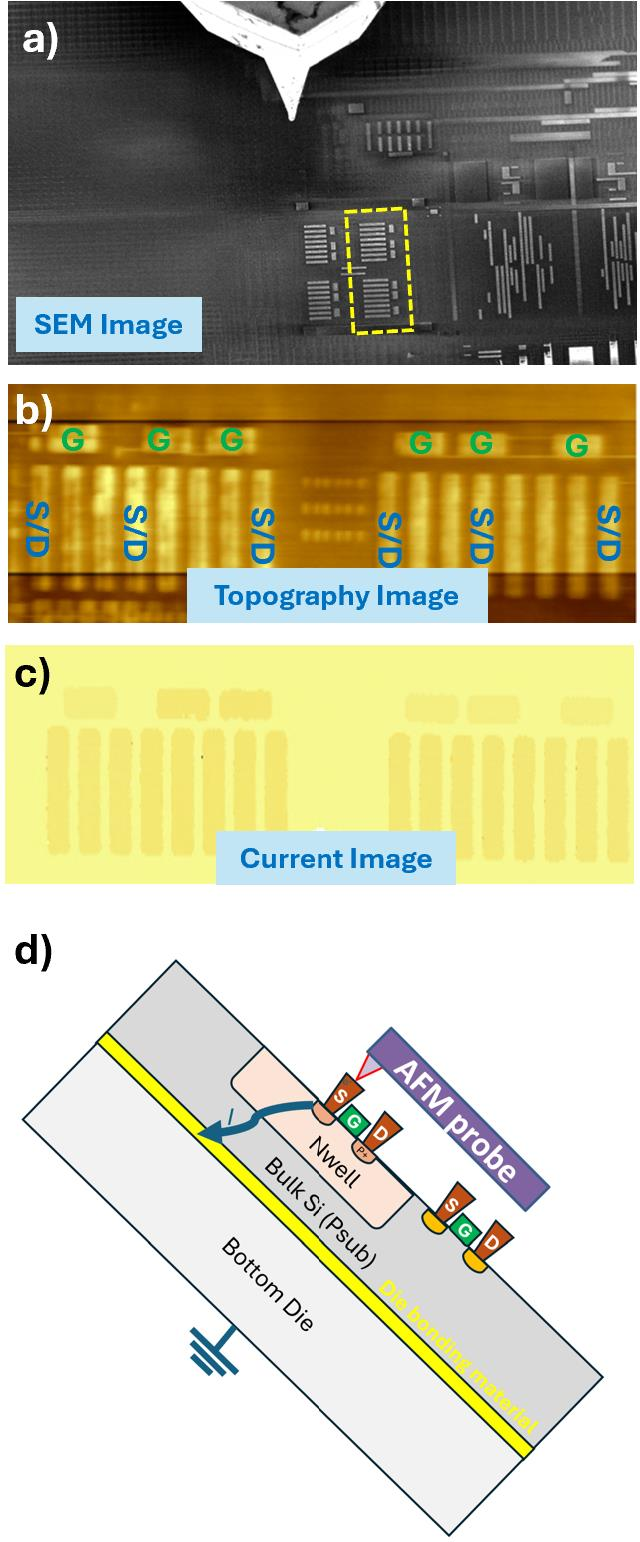
Figure 10 +11: Stacked die case study: (a) SEM image after delamination (b) AFM topography (c) initial C-AFM current diagram (no anomalies found) (d) C-AFM current diagram after ground trench milling (two high current anomaly structures found) (e) Schematic diagram
Why is the current so low? The reason is that another die is bonded underneath the failed die, and the insulating bond material between the two layers blocks the current path. Standard C-AFM requires good electrical grounding of the bulk silicon for current to flow from the probe tip, through the device p-n junction, to the grounded AFM sample table. The insulating bonding layer breaks it all.
The solution is surprisingly simple: within the same pFIB cavity, a deep trench is milled near the suspect transistor, extending all the way down to the die below, providing a ground path for the transistor's N-well structure. There is no need to move the sample throughout the process.
After the ground trench is created, C-AFM current imaging is performed again - this time the two structures show abnormally high currents, which are completely inconspicuous in the previous current diagram. Subsequent layout analysis confirmed that these high current structures were connected to a parallel transistor gate array, indicating that at least one gate was defective.
To further locate the specific failed gate, the sample is delaminated to a lower level with pFIB gas-assisted parallel milling - where the individual gates are separated. The second C-AFM current scan successfully identified the two leakage gates.
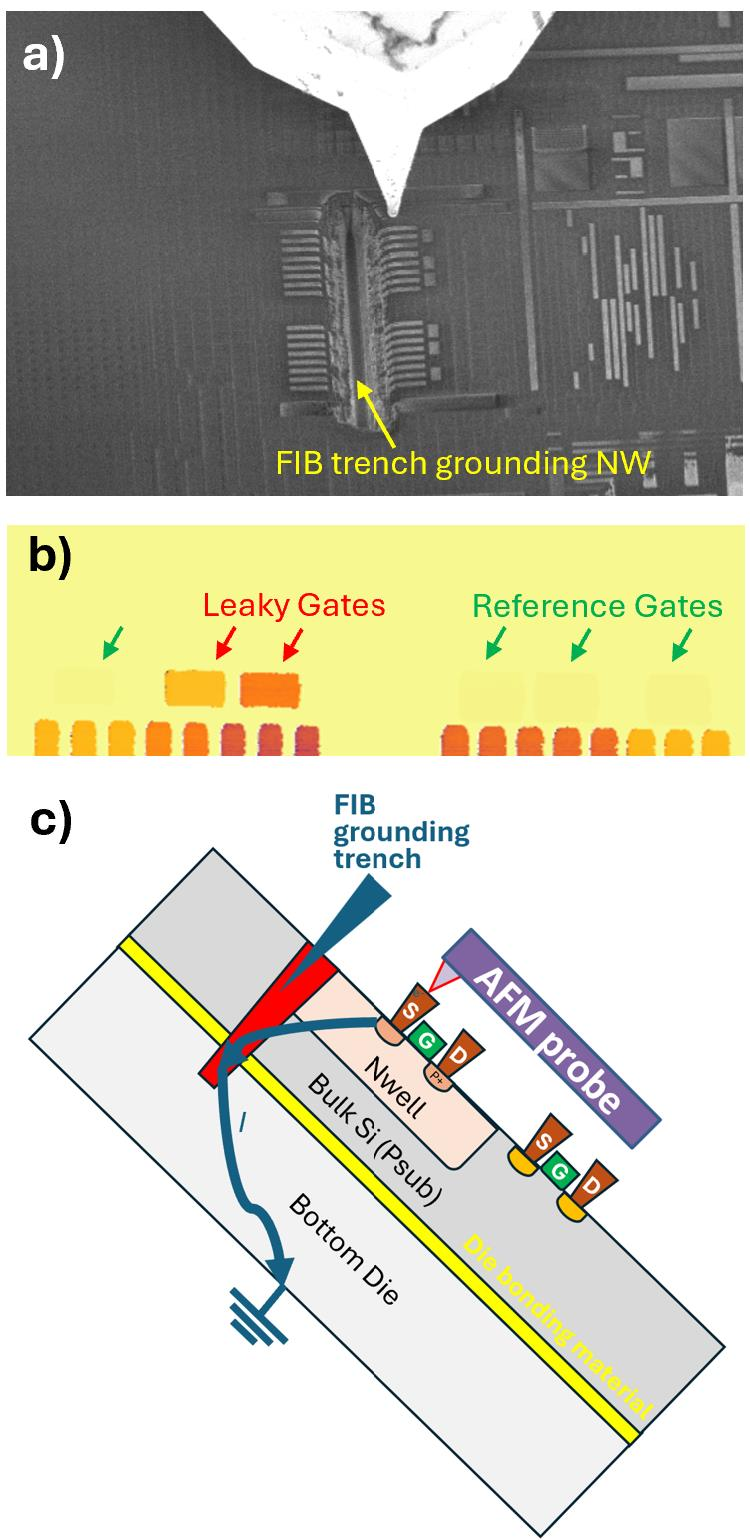
Figure 12: After pFIB milling creates a deep trench for suspicious circuit well structure grounding, the transistor-level C-AFM current image successfully identifies two leakage gates
After precisely locating the defect location, the leakage gate is extracted with FIB and thinned into TEM flakes. The transmission electron microscope physical analysis confirmed that the leakage was due to the breakdown of the gate oxide layer - which is the root cause of the chip failure.
This case also demonstrates another unique advantage of the integrated solution: the measurement position is immediately adjacent to the deep trench created by the FIB, and it is easy to damage the probe when the traditional AFM analysis scan crosses the trench.
However, with real-time SEM imaging, the AFM probe is accurately and efficiently positioned on the target area next to the trench before scanning begins, completely avoiding the risk of probe damage.
07| Summary: What exactly has changed with this package?
Recalling this work by NVIDIA and NenoVision, the core values of integrating the C-AFM-pFIB platform can be summarized in three points:
First, efficiency gains. The combination of pFIB gas-assisted milling with in-situ C-AFM current imaging eliminates repetitive vacuum cycles and manual sample transfer, significantly reducing analysis time. The mode toggle is just a few mouse clicks away while keeping the surface of the sample clean and the probe aligned.
Second, quality assurance. The entire process is accomplished in a single vacuum environment, with the sample surface remaining in a pristine, oxidation-free and contamination-free state at all times, which is essential for high-quality C-AFM current imaging. The iteration of layer-by-layer de-layer and layer-by-layer imaging achieves precise spatial registration across layers.
Third, capacity expansion. SEM-assisted navigation has greatly improved the speed and accuracy of probe positioning; the synergy of electron beams with C-AFM has led to the new technology of scanning EBIC microscopy (SEBICM), which can map the behavior of sub-surface junctions at the nanoscale; pFIB can even directly "modify" circuits (such as creating ground paths) to make stacked structures that could not otherwise be analyzed measurable.
For advanced semiconductor failure analysis, this is not only a tool improvement, but also a workflow reconstruction - the analysis process scattered in multiple devices, multiple links, and multiple transfers in the past is compressed into a closed loop in a vacuum cavity. As the process continues to shrink and the device structure continues to complicate, this idea of "in-situ integration" is likely to become the standard direction for advanced failure analysis.
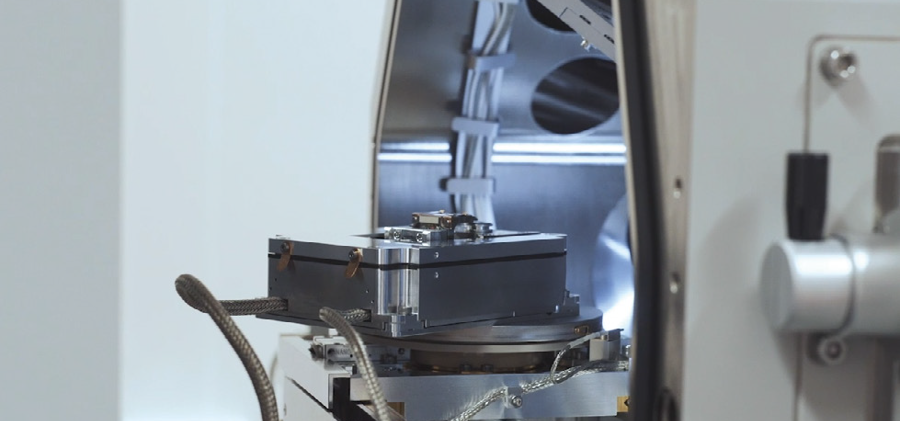
NenoVision's LiteScope AFM-in-SEM - an atomic force microscope designed to be loaded with a scanning electron microscope - can also be used independently of the electron microscope.
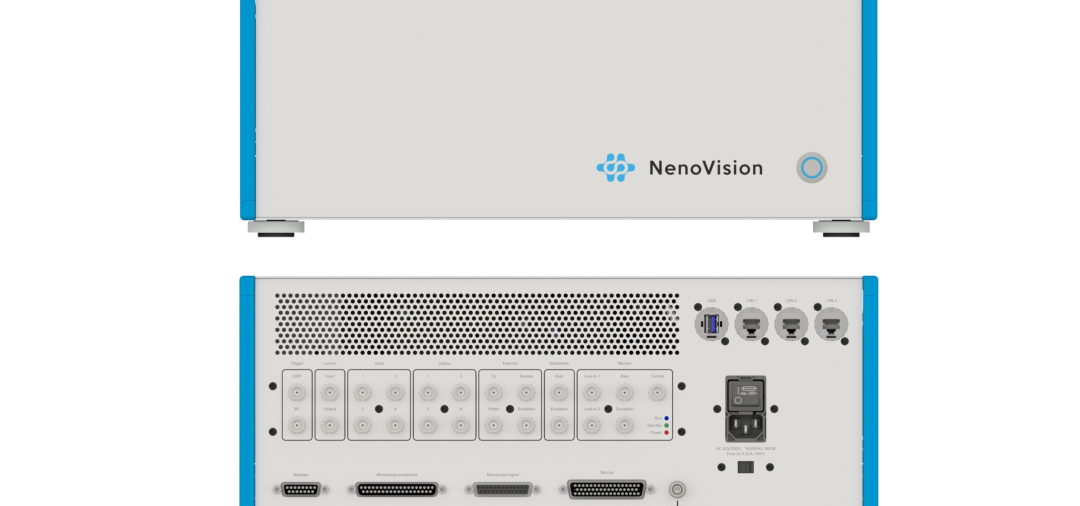
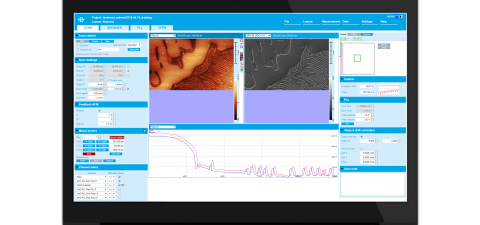
The complete system consists of a LiteScope scanning unit, a NenoBox control unit, and NenoView software, supports CPEM-associated imaging, and loading and unloading is usually completed in five minutes. The open-loop scanning range is about 100 × 100 × 20 µm, the closed-loop is about 80 × 80 × 16 µm, and the noise is as low as 35pm. For labs looking to replicate this process, it offers an off-the-shelf path - connecting CAFM capabilities to existing FIB/SEM platforms without the need for an additional standalone AFM.
As an authorized agent of NenoVision China, XBOUND can assist in confirming the adaptation of SEM models, arranging installation demonstrations and providing product data.
Literature Sources
This article is adapted from ISTFA 2025 conference paper: Chuan Zhang, Jane Li (NVIDIA); Radek Dao, Rosalinda Ring (NenoVision). Streamlined Advanced Semiconductor FA Through In-Situ C-AFM and Plasma FIB Integration. Proceedings of ISTFA 2025, ASM International.
Core Sources of Facts
1. Principles of C-AFM technology and comparison with SEM PVC: Introduction to the paper and Figures 1 and 2;
2. The principle of pFIB gas-assisted delamination: Figure 3 of the paper and the description of the relevant text;
3. Integrated system workflow (three mode switching): Experimental part of the paper and Figure 4;
4. The experimental sample is a 5nm grade process integrated circuit die: Experimental part of the paper;
5. The delamination window size is 100 × 100 µm ²: Experimental part of the paper;
6. The inclination angle of the sample platform is 52 degrees: Experimental part of the thesis;
7. Logical unit and SRAM layer-by-layer C-AFM imaging results: Figure 7 and Figure 8 of the paper;
8. Scanning EBIC Microscopy (SEBICM) technical principles and results: relevant sections of the paper and Figure 9;
9. Stacked die packaging case study (grounding trench, leakage gate positioning, TEM confirmation of gate oxide breakdown): Case Study section of the paper and Figure 10-12.
IMAGE SOURCE
The accompanying drawings are taken from Figure 1–12 of this paper, and the copyright belongs to the original author and ASM International.
NenoVision AFM-SEM Series Products
LiteScope AFM-in-SEM
LiteScope Scan Head
NenoBox Control Unit
NenoView Control Software
Hotline: 8621-3358 6350 | E-mail:info@xbound-tech.com
XBOUND Characterization Technology is committed to exploring the microscopic world boundaries, focusing on advanced electron microscopy and multi-dimensional characterization technology. Through innovative instrument platforms and professional solutions, electronic microscopy, in-situ analysis, photoelectric correlation and intelligent characterization technologies are connected, providing unlimited possibilities for scientific research and industrial innovation.At present, we mainly provide the following products: advanced SEM/TEM accessories such as Delmic cathodoluminescence in the Netherlands, NenoVision electron microscope atomic force microscope in the Czech Republic, and Waviks in-situ laser heating and light excitation system in the United States. At present, there is a demo experience center in Shanghai, and after-sales service covers the whole country.


Scan the code to focus on "XBOUND Characterization Technology"
 021-3358 6350